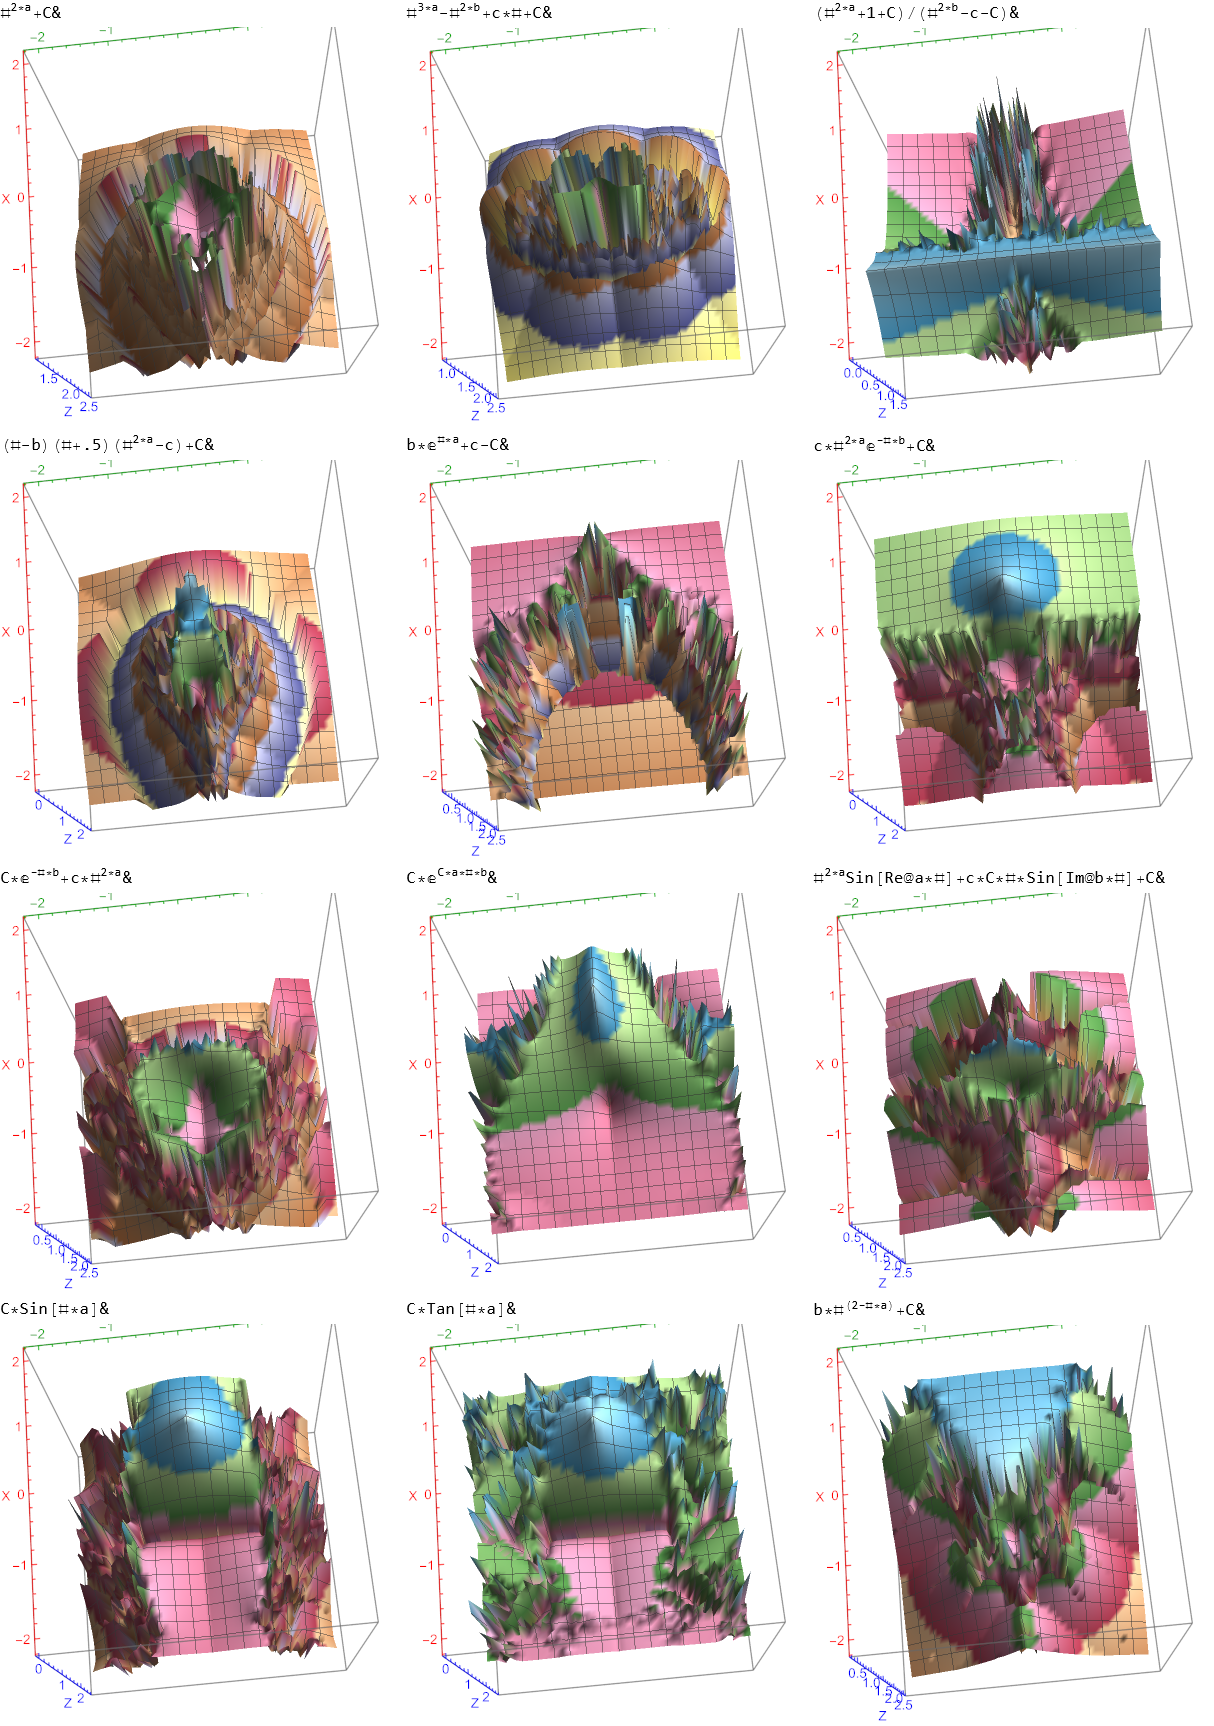
Below are SVG images of output from Pane 1 (Chaos) and Pane 17 (AI) of the VisibLie_E8 visualization tool:


Greg Moxness, Tucson AZ
Below are SVG images of output from Pane 1 (Chaos) and Pane 17 (AI) of the VisibLie_E8 visualization tool:
Greg Moxness, Tucson AZ